Sunday, July 4, 2010
PSEi July 2, 2010
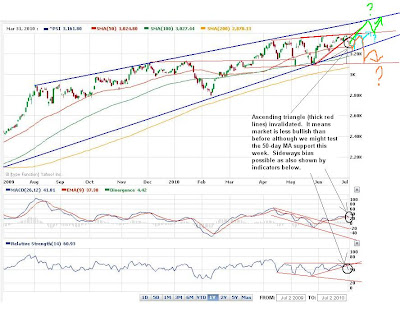
In my previous entry, I mentioned that the PSEi was forming a higher-low, which was a bullish signal. The index continued to form another higher-low on the way to form an ascending triangle pattern, which is also a bullish pattern. Unfortunately, poor economic data abroard, China's slow down, European debt issues and global equities sell-off weigh down our market as well, making the ascending triangle pattern invalid (breakdown of the thick red line). :( However, we're nearing the blue uptrend support line. Could we possibly form another ascending triangle albeit with a lesser uptrend gradient (blue thick line)? I would really hope so.
Possible scenarios on what might transpire to our market in the next few weeks are in orange, turquoise and light green lines. My personal take is the turquoise line, although what worries me is the bearishness of the US markets. The Dow and S&P are showing head and shoulders breakdown pattern. But if many people are seeing the same pattern as I do, many would be in the sidelines rather than in the market. So who would sell down the market anymore? Could this negate the head and shoulders breakdown pattern? I hope it would.
Saturday, June 19, 2010
PSEi June 18, 2010
The PSEi was trading on a broad rectangle (somewhat) for quite some time now (since April of this year until now) with 3,100 area as support and with 3,330 to 3,360 as resistances. The first trough within the rectangle (around mid-April) did a bounce even prior to support areas (both previous-highs-now-turned-support (3,130) and the 50-day moving average (maroon line)). However, the second and the third troughs (both in May) pierced through the above supports (both the 3,130 and the 50-day MA), but found some buyers towards the 100-day MA (green line). This was bearish because selling pressures were still prevalent even at previous supports so it needed to correct some more and find more buyers at lower prices, which was incidentally the 100-day MA.
But in June, as market tried to correct again, we found supports now raised higher from 100-day to back to 50-day MA again as you can see in the picture above. This was a higher-low, which is a bullish signal. That means, more buyers are willing to take more risks at higher prices than before thinking that the market's correction is already enough even at that point. Could this propel us above the resistances? Both MACD and RSI confirms a higher-low. Could our market be trending again pretty soon? I think we will pretty soon. I have to admit that our market seems to be very resilient compared to other markets. Let's see next week!
If we do breakout soon, we could see our market hit possibly 3,500 to 3,600. If not, then possibly we'll consolidate some more within the range of 3,240 to 3,360 to gain a better and stronger base. Let's watch out for foreign activity.
Tuesday, June 1, 2010
Good to be back?!
Nine months! It had been such a long time already since my last entry. I was so busy and honestly it was a bit burdensome to write something here haha! The reason why I wanted to write again is because the market made me call May-day last May. January to April 2010 were good months for me as far as year-to-date returns are concerned. Unfortunately, a series of crisis in May bore a huge brunt in my YTD returns. 2/3 of my gains was lost. Oh great! At least I could still thank the Lord that I'm still positive overall YTD.
"Naked I came from my mother's womb, and naked I will depart. The LORD gave and the LORD has taken away; may the name of the LORD be praised" (Job 1:21 NIV).
Subscribe to:
Posts (Atom)